Area reports
A report on a neighbourhood rather than a house — what is for sale, what sold, what it fetched, and how fast. The farming piece, computed rather than written.
Market → Market reports.
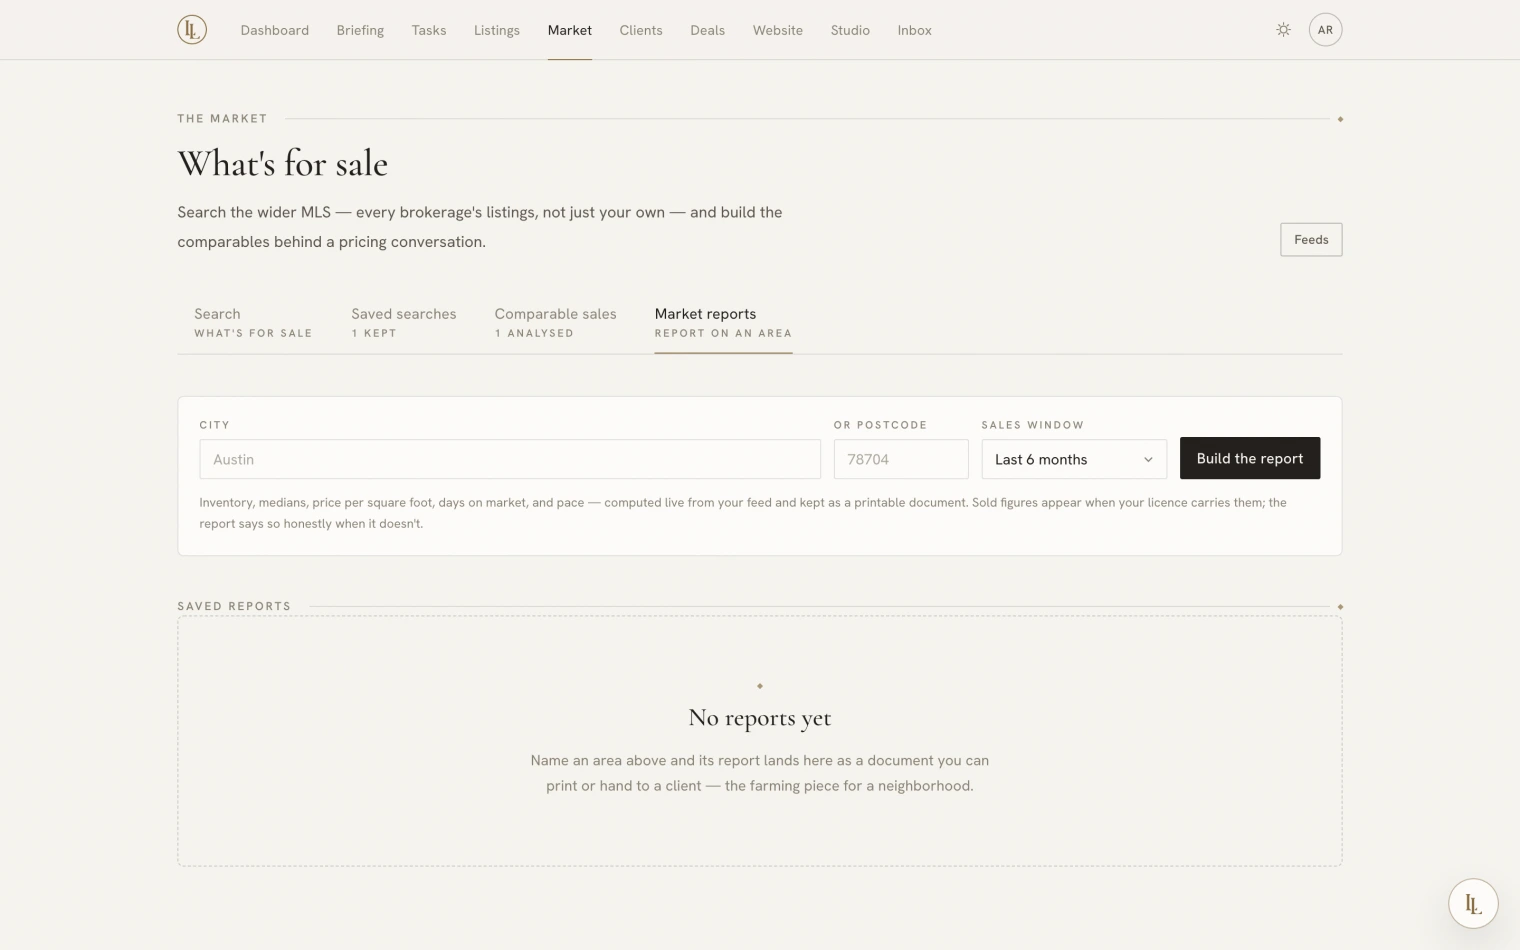
Building one
Type a city or a postcode, choose how far back to count sales, and press Build the report.
Or ask:
Build me a market report on 78704, last six months.
What is in it
| What’s for sale | How many, the median asking price, the price per square foot |
| What sold | How many, the median, what it fetched per square foot |
| How long it took | Median days on market |
| The pace | Months of inventory — how long the current supply would last |
Every figure is computed from your feed. Nothing is estimated and nothing is written by hand. Months of inventory is left out below three sales, because a pace worked out from two sales is a number with no meaning.
The report writes its own short reading of the figures. If the sold side is not available on your licence, it says so in its own words rather than showing blank rows.
Using it
A saved report has its own address and prints. Print / Save as PDF gives you something to hand out at a door, attach to an email, or put in a listing presentation.
Like a comparables analysis, a saved report is a snapshot — it stays as it was computed. Build a fresh one next quarter rather than expecting this one to move. Only the title, your notes, and the client it is for can be edited.
Sold figures are licensed data. An area report is agent-facing — the app and the printed page. It never goes on a public website.
A demonstration feed
If your workspace is connected to the sample market feed rather than a real MLS, every report says so loudly — on the page, on the printed footer, and on the credit line for each property. Fabricated comparables on a seller document would be a serious thing, so the sample feed is impossible to mistake for a real one.